If he doesn't, Trump’s newest round of tariffs will undermine America’s interests abroad and push our allies closer to our enemies. The window for him to avoid disastrous consequences from foreign policy is quickly approaching.
Trump's tariffs are undermining America's place in the world
The rest of the world will not abandon globalization just because the United States has. Countries that have had their economies decimated by Trump’s policies will not be eager to regain our good graces.
In all likelihood, our voluntary destruction of the world economy will only push our allies further toward our enemies. Nobody will be happier about these policies than China and Russia. The second Trump presidency gives them the biggest opportunity to expand their sphere of influence since the end of World War II.
There's an argument to be made for targeted tariffs on Chinese goods. The 145% tariffs that the Trump administration has now slapped on our great rival are much higher than what makes sense, but disincentivizing investment in China has value for America.
However, that's not what we are doing. Rather than tariff China and encourage manufacturing elsewhere, we are punishing even the countries that have long provided alternatives to Chinese manufacturing.
Countries like Vietnam, where 30% of the economy depends on exports to the United States, are going to have their economies crumbled if exporting to America becomes infeasible. The alternative is that they find other nations to manufacture goods for; in all likelihood, those nations will not be our allies.
For decades, we have encouraged companies to manufacture in Vietnam to give them an alternative to China. If Vietnamese goods become unaffordable, the incentive for companies to avoid Chinese manufacturing will also disappear.
Chinese President Xi Jinping has already expressed his desire to improve influence over Vietnam in light of American tariffs, and with nowhere else to go, Vietnam may be forced to cozy up to the Chinese Communist Party.
Fears that the United States will lose its status as the “world’s reserve currency” that have existed for years will only be exacerbated by this. Even if we reverse course, neither our allies nor our trading partners have any reason to trust that Trump’s whims won’t shift back in favor of tariffs. Trump's volatility is undermining the United States’ role in the world.
The off-ramp is quickly approaching if Trump wants deal
Trump and his allies have been oscillating between the explanation that tariffs will create jobs and the explanation that these are a negotiating tool to promote free trade.
There are people in Trump’s camp, including Elon Musk, who disagree wildly on the end goal of these tariffs.
It's not just our enemies that we are entering this trade war with. Europe has already announced its own possible retaliatory tariffs. America is willingly vacating its role in the world of trade, and the chance to backtrack is quickly disappearing.
Trump has the opportunity to avoid much of the long-term consequences of his actions, but the window is closing for him to do so.
Should Trump want to save face in light of the disastrous market response, all he needs to do is drop tariffs on countries that make concessions to the United States. Making the tariffs truly reciprocal and opening up free trade with partners willing to drop barriers against us could actually deliver a political good from this.
This action wouldn’t fix Trump’s broken logic surrounding trade deficits and their harm, but it would give him an easy political out to save face before the economy crashes in its entirety. This should allow for the tariffs to deliver a political win for Republicans and to stroke Trump’s “art of the deal” ego.
However, if countries see that there truly is no negotiating out of these heightened tariffs, it's only a matter of time before they begin orienting their economies away from America, and aside from Europe, the only other places to go are to our enemies.
The reality is that Trump’s stubbornness likely doesn’t allow for this. He has been convinced of the effectiveness of tariffs for decades; he isn’t likely to let economists and the entire economy crumbling stop him.
America is quickly approaching the off-ramp, and Trump would be wise to take it. America, and in turn the entire world, will suffer if he chooses to prolong the madness of tariffs.
With new tariffs on China back in the headlines, this post seeks to offer some perspective on how much China’s exports have really been affected by multiple rounds of U.S. tariffs and export restrictions over the past seven years. The key takeaway is that U.S. imports from China have decreased by much less than has been reported in official U.S. statistics. As a result, the recent tariff increase on China could have a larger impact on the U.S. economy than is suggested by official U.S. data on the China import share, especially if favorable tariff treatment for direct-to-consumer imports is ended.
A Brief Background
This post will use as a starting point the trade actions taken against China beginning in July 2018. At that time, the U.S. imposed the first of multiple rounds of tariff increases. In the process, the statutory tariff rate on U.S. imports from China increased from 2.7 percent to 17.5 percent, which was largely left unchanged during the Biden administration. The Trump administration has now imposed additional 10 percent tariffs on all Chinese goods—including goods that had been excluded from previous tariff increases, such as consumer electronics—and has ended (a termination that is paused for now) preferential treatments for so-called de minimis imports, which had incurred zero tariffs previously so long as they were valued at less than $800 and met certain other requirements.
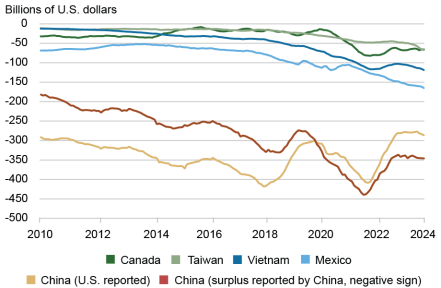
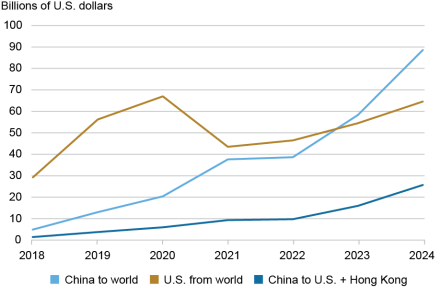
The chart below plots the evolution of the U.S. trade balance with China and some other major trading partners. The U.S.’s trade deficits with other countries have increased continuously since 2018, which in part has reflected a shifting of manufacturing production chains out of China into third countries. The balance with China has either increased or decreased, depending on which country’s data one chooses to believe. This discrepancy is the focus of the rest of this post. For simplicity, the data shows only trade with China alone; the story remains the same if one adds trade with Hong Kong.
The U.S.’s Trade Deficit Increased Broadly
Source: IMF Direction of Trade Statistics. Note: China trade balance reported by the U.S. excludes insurance and freight cost of imports, while China’s reported surplus with the U.S. includes these costs.
U.S. Imports from China Did Not Decline as Much as Widely Believed
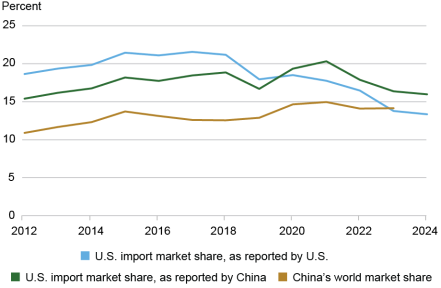
An obvious question is “how much have U.S. imports from China decreased?” This seems like it should be an easy question to answer, but it turns out not to be. As shown in the chart below, the simplest and most frequent answer is “a lot.” According to U.S. statistics, imports from China fell from 21.6 percent of total U.S. imports in 2018 to 13.4 percent in 2024. The nominal value fell from $505 billion to $439 billion, a $66 billion decline.
China’s Share of U.S. Imports Has Decreased a Lot…or Only a Little
Sources: U.S. Census; China General Administration of Customs; IMF Direction of Trade Statistics via Haver and CEIC.
However, an alternative picture is also shown in this same chart. According to China’s own data, its exports as a share of the U.S. import market have only declined by 2.5 percentage points, less than one-third of the decline shown in the U.S. data. In fact, China’s data says that its exports actually increased by $91.2 billion, to $524 billion (exports were even higher during the pandemic, but have since declined). Moreover, while the U.S.’s reported trade deficit with China from the beginning of 2018 to 2024 declined from $375 billion to $295 billion, China’s reported trade surplus with the U.S. increased from $278 billion to $360 billion.
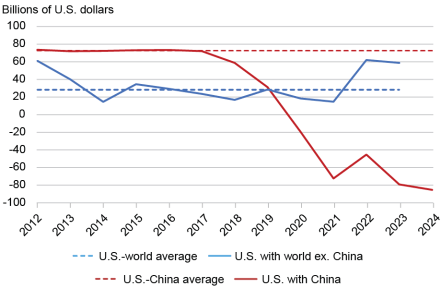
What’s going on here? Mechanically, as illustrated in the chart below, there has been a huge shift in the discrepancy between what the U.S. says it imports from China and what China says it exports to the U.S. (hereafter called the “import gap”). Simply stated, the U.S. is saying it buys from China a lot less than what China says it is selling. The chart shows in solid red this gap and in dashed red the average gap before 2018. A downward shift clearly began in 2018, with the difference between the average line and the observed data in 2024 amounting to $158 billion. There has been only a partial offset from a larger positive gap with the rest of the world, as shown in the solid and dashed blue lines, with data through 2023. As a result, there appears to be more than $100 billion in “missing imports” headed for the U.S. when comparing the U.S. and the rest of the world’s data, virtually all of which can be attributed to China.
The U.S.’s ‘Missing Imports’
Sources: U.S. Census; China General Administration of Customs; IMF Direction of Trade Statistics via Haver and CEIC. Notes: The red and blue solid lines show the difference between U.S. reported imports from China and the world excluding China and those trading partners’ reported exports to the U.S. The dashed lines show the respective averages from 2013 to 2017.
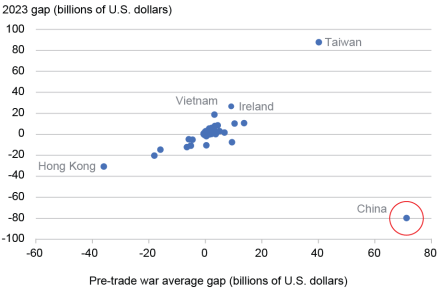
While it is normal for there to be discrepancies between countries’ mirrored import and export data, the shifts observed with China are much too large and persistent to be explained by normal variation or technical factors. The scatter plot below shows the average and 2023 values of the U.S. import gap for all of the U.S.’s trade partners. China is clearly an extreme outlier, both in terms of size and direction of movement (from positive to negative, into the lower right corner). There are notable offsetting movements in Taiwan and, to a lesser extent, Vietnam, but these are much smaller than China’s. The trade gap with China is not primarily driven by a shifting of trade through third countries. Such shifting appears to be accurately reflected in U.S. statistics, with some partial exceptions. Rather, it is an issue of measurement.
China Is an Extreme Outlier
Source: IMF Direction of Trade Statistics. Notes: “Gap” refers to the U.S.’s reported imports from a country minus the country’s reported exports to the U.S. The horizontal axis shows the average value of the gap before 2018, and the vertical axis shows the value of the gap in 2023; for example, for China, the gap averaged +$17 billion before 2018 and almost -$80 billion in 2023. The gap in Ireland primarily reflects corporate tax minimization strategies and is not relevant for the discussion in this post.
Export Taxes in China, U.S. Tariffs, and De Minimis Distort the Trade Picture
It is not possible to precisely explain this discrepancy. However, as discussed in this note from 2021 using data available through 2020, an important set of factors involves fictitious exports from China to take advantage of certain value-added tax rebate benefits within China, and underinvoicing of U.S. imports to reduce tariff duties owed to the U.S. government. In 2020 these factors were estimated to have led to an overstatement of China’s exports to the U.S. of about $12 billion and an understatement of U.S. imports from China of around $55 billion, accounting for about $67 billion of the gap at the time.
Perhaps an even more important factor now is the de minimis exemption that has allowed imports from China to enter the U.S. duty free and with light documentation. The value threshold for this exemption was raised from $200 to $800 in 2016, and since then a combination of high import tariffs and innovations in direct-to-consumer business models have contributed to explosive growth. This trade is at least partially measured in China’s export statistics but is absent in U.S. import statistics. The chart below shows the available data for this type of trade as reported in China’s official export statistics and estimated by U.S. Customs and Border Protection (CBP), which is not included in U.S. import statistics.
Direct-to-Consumer Trade Is Surging
Sources: China General Administration of Customs; U.S. Customs and Border Protection. Note: The lines labeled “China” are official Chinese customs export statistics of HTS codes 9804 and 9805, while the line labeled “U.S. from” reflects U.S. Customs and Border Protection estimates.
Such trade is not well measured but is very substantial and growing rapidly. For example, as discussed in a recent note by the Congressional Research Service, the U.S. CBP has estimated that total de minimis exports from China (including via Hong Kong) accounted for about 67 percent of the U.S.’s total de minimis imports during fiscal years 2018 through 2021. According to data estimated by the CBP, this total was about $200 billion, implying an average of about $34 billion per fiscal year from China. During this same period, China’s officially reported de minimus exports to the U.S. and Hong Kong totaled $21 billion, less than one-fifth of the CBP’s estimate.
China’s own statistics likely undercount, or at least misappropriate by destination, this trade, but nonetheless can be useful to help extrapolate the trend to the end of last year. During U.S. fiscal years 2022 through 2024, China’s total official de minimis exports to the U.S. and Hong Kong surged by 176 percent, to $25.7 billion, with the total to the world growing by 136 percent, to $88.6 billion. The CBP’s latest fiscal year 2024 figures for the U.S. in total (separate figures for China are not available) increased by almost 50 percent to almost $65 billion. Given these trends, it appears highly plausible that the U.S.’s de minimis imports from China increased by at least 50 percent, or even more than doubled, and were in excess of $50 billion last year.
Concluding Thoughts
The data presented in this post illustrates how large increases in tariffs against China have contributed to distortions in trade statistics caused, in part, by private sector efforts to avoid payments on customs duties. In fact, the rapid expansion of low-value direct-to-consumer sales from China has allowed a very substantial amount of trade to completely bypass all of the tariffs that have been imposed on China beginning in 2018. This post has suggested that there appears to be upwards of $100 billion in “missing imports” in U.S. data, and quite possibly at least $50 billion may be accounted for by this de minimis trade. This suggests that U.S. consumers could face larger consequences than meet the eye from the recent 10 percentage point tariff increase if the de minimis exception is ended for China and Chinese sellers do not slash their profit margins by reducing their export prices. For example, a sweater bought from China through an online retail site would rise in price to the extent the firm does not offset the new 33.5 percent tariff charge (16 percent general duty plus 7.5 percent on Chinese imports applied in 2019 plus 10 percent applied this year), not even including additional handling charges that the seller may impose to account for more costly customs procedures.